Program Management Dashboard
GrowthBook provides a Program Management Dashboard to help you understand your experimentation program at a glance. This document covers several key sections of the dashboard and how to use them effectively.
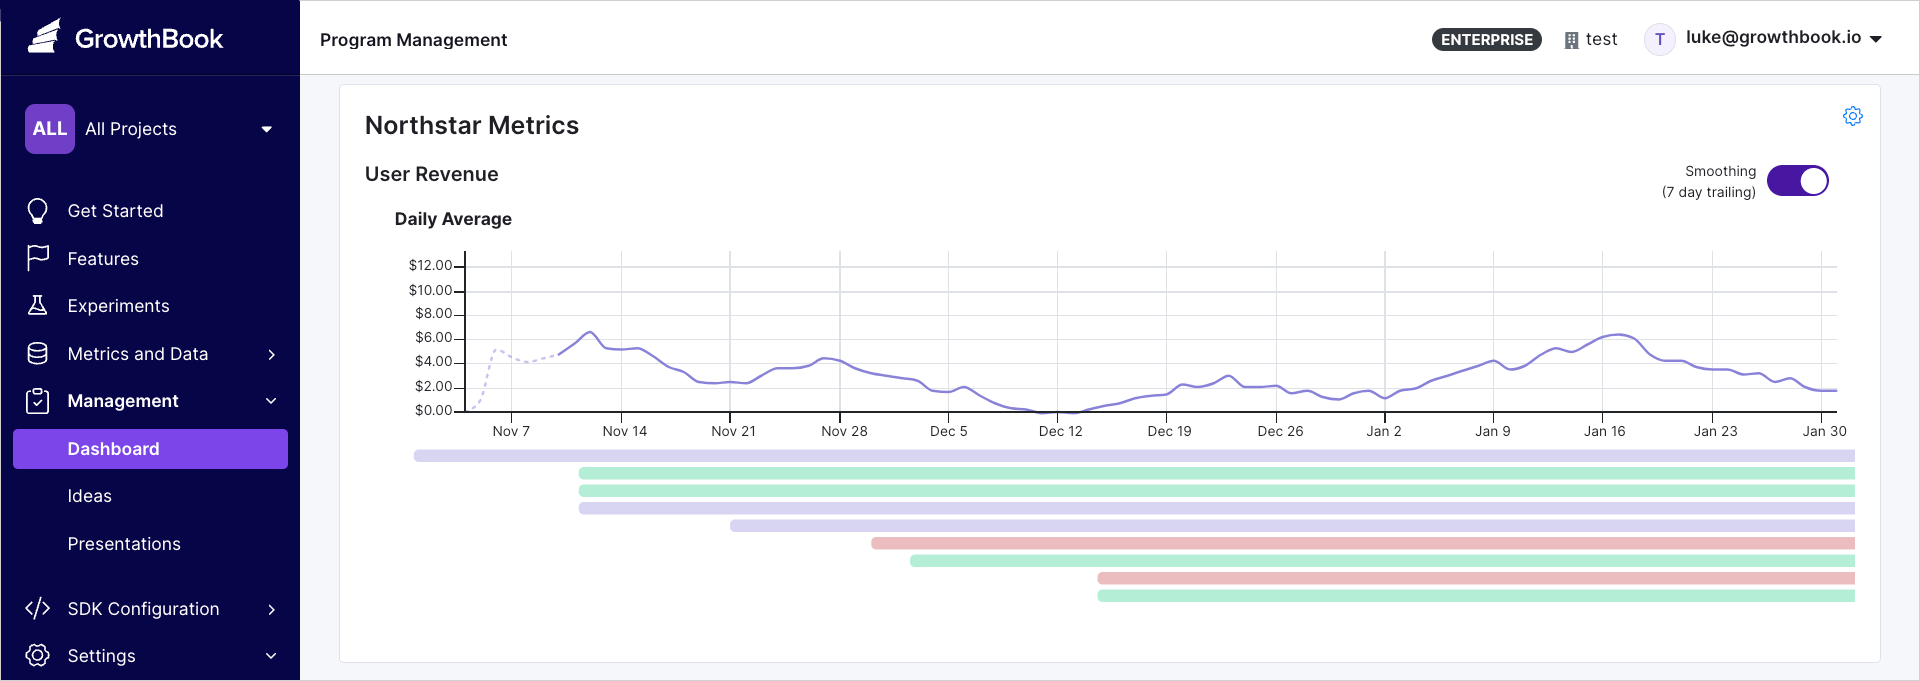
North Star Metrics
North Star Metrics are crucial, company-wide indicators of success. This panel displays how these metrics evolve over time and shows which experiments using this metric are running (or when they ended). If this panel isn't visible, go to Settings → General to set up your North Star metrics.
Experiment Impact
Summed experiment impact relies on several assumptions (independence of experiments, additivity of experiment impacts, and no selection bias). This tool should not replace accurate impact estimation via holdouts.
Experiment Impact provides an overview of how multiple experiments have influenced a key metric. Besides letting you filter by metric and project, you have two other filters:
- Date Ended: Use this filter to only include experiments that ended within a specific date range. The filter defaults to the last 6 months. Leaving the end date open will include today's date and any ongoing experiments.
- De-bias: To mitigate the natural bias in experiment outcomes (where more decisive results tend to show larger effects), we use the positive-part James-Stein shrinkage estimator. This estimator adjusts the results by estimating variance only from the shown experiments and shrinks all impacts toward zero. While this reduces selection bias, it does not address concerns about the independence or additivity of experiments.
We split experiments into three categories:
- Won: Experiments that have been stopped and marked as "won," with a non-baseline variant selected for deployment.
- Lost: Experiments that have been stopped and marked as "lost," meaning the baseline, or status quo, is the variation to deploy.
- Other: Running experiments or other stopped experiments marked as Inconclusive" or Did Not Finish.
For each category, we sum the "scaled impact" of the experiments in that category to present the total impact. The chosen variation for estimating overall impact varies by outcome: For "Won" experiments, we use the selected variant; for "Lost," we use the variation that performed worst relative to the baseline.
Scaled Impact
Scaled impact rescales your experiment effect to answer the question, "What would the total effect be if all participants had received a specific test variant?" For example, imagine your absolute lift in an experiment is $0.30 per user with 100 users in that variation. If your experiment got 50% of total traffic, and that variation received 50% of that traffic, then the total potential traffic was 100 / (50% _ 50%) = 400 users. So, the scaled impact would be $0.30 _ 400 = $120. It is a simple rescaling that makes some assumptions, but it does allow you to compare the effects of experiments on different parts of your product (e.g. a big change to a small feature vs. a small change to a big feature might have the same scaled impact).
Total Impact The total impact sums the effects of all experiments within a category. This assumes the effects are independent and not additive. This is not an assumption easily satisfied, but it allows you to get a general sense of scale.
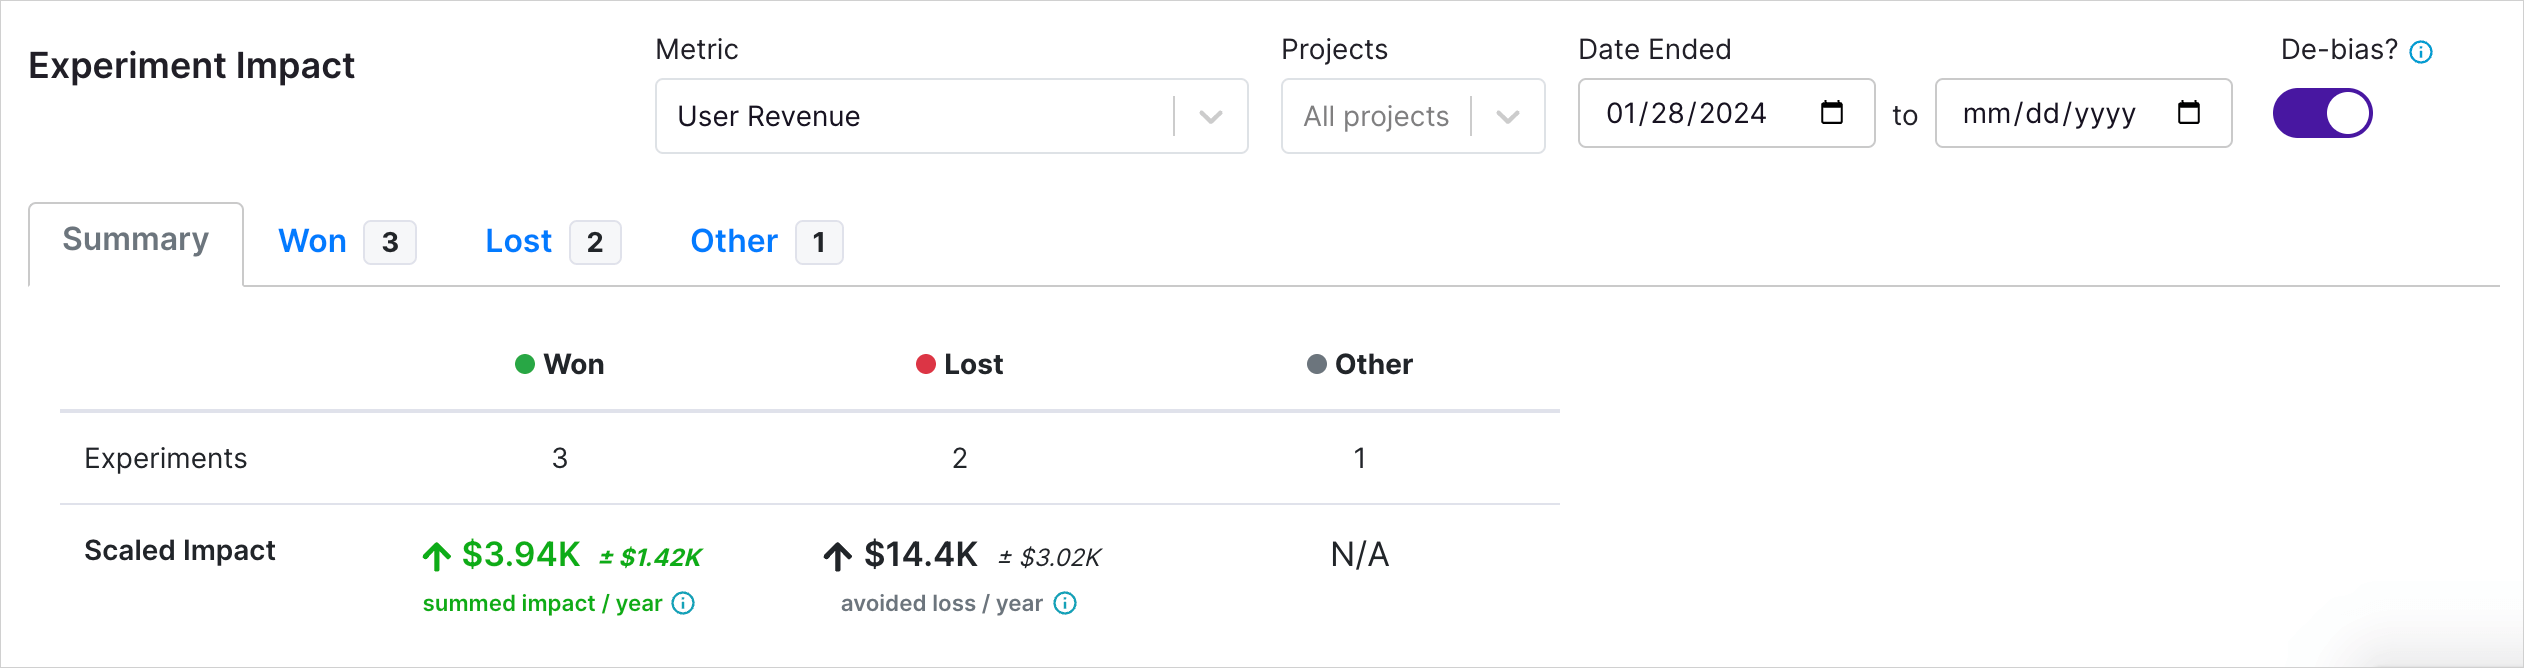
Example
In the above screenshot, we have 3 experiments that had test variants shipped ("Won") and 2 that had the baseline variation maintained ("Lost"). In both cases, experimentation had a positive impact. In the case of "won" experiments, experimentation allowed us to ship improvements to our product and measure the impact. In the case of "lost" experiments, we learned that certain variations would have caused a decrease in our key metric had we shipped it. Avoiding shipping losing variants is an important component of an experimentation program.
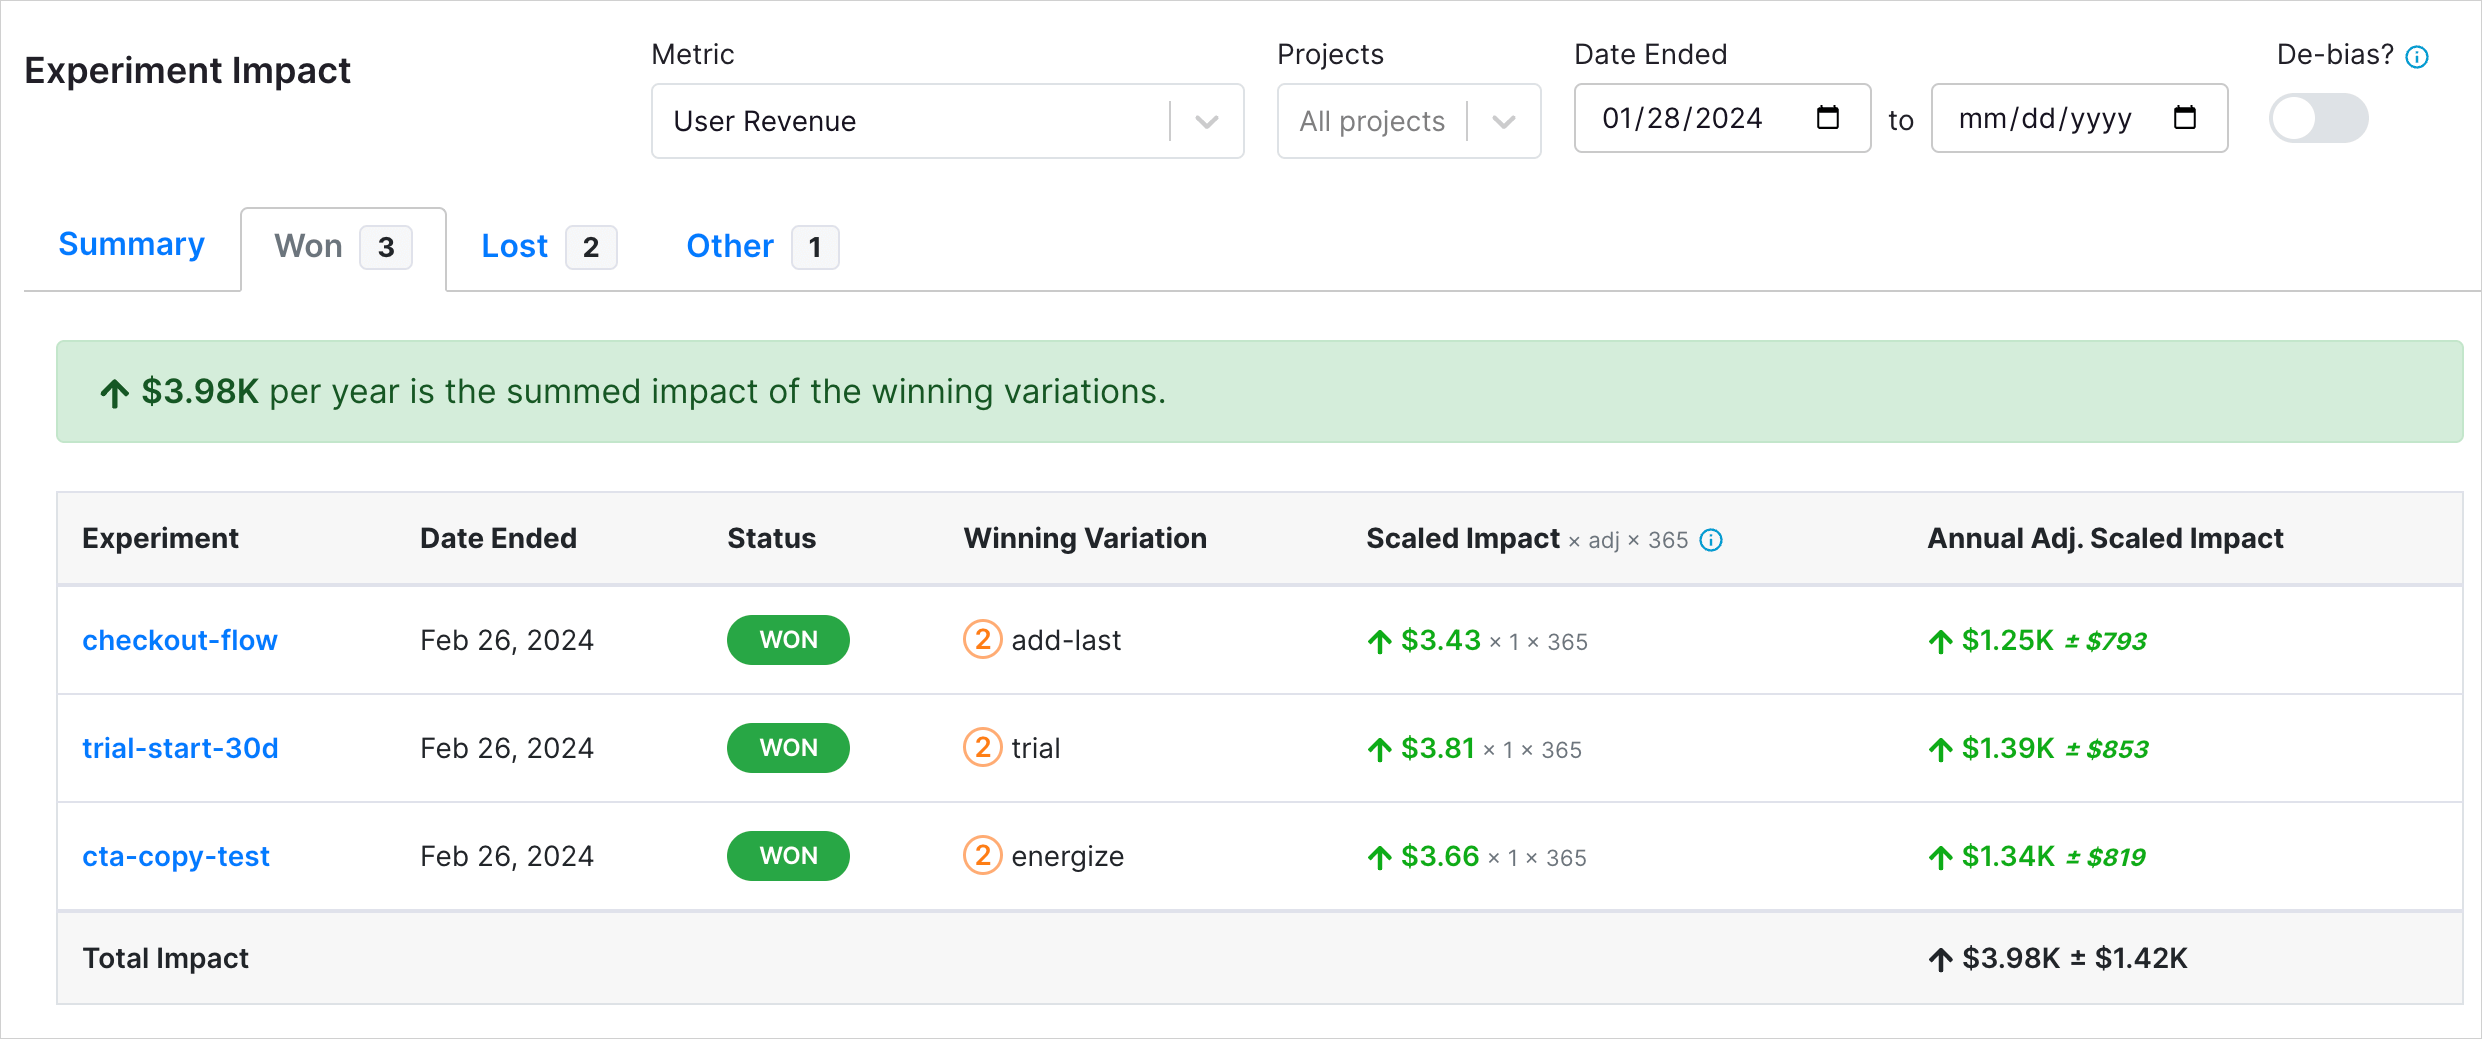
On the "won" tab, we see 3 experiments where we shipped a test variant. The metric here is "User Revenue". In the Scaled Impact column, we can see that the scaled impact of the checkout-flow experiment is 3.43. This means that if the test variant add-last was deployed to 100% of users that hit that experiment, we would have seen a total increase per day of $3.43. We scale this up to annual impact, and we get $1.25k per year. We also show you the confidence interval, here plus-minus $793, indicating this was a statistically significant effect.
Sum these scaled impacts to get the total impact. Note, again, total impact assumes independence and additivity of effects, and the true value will likely be lower.
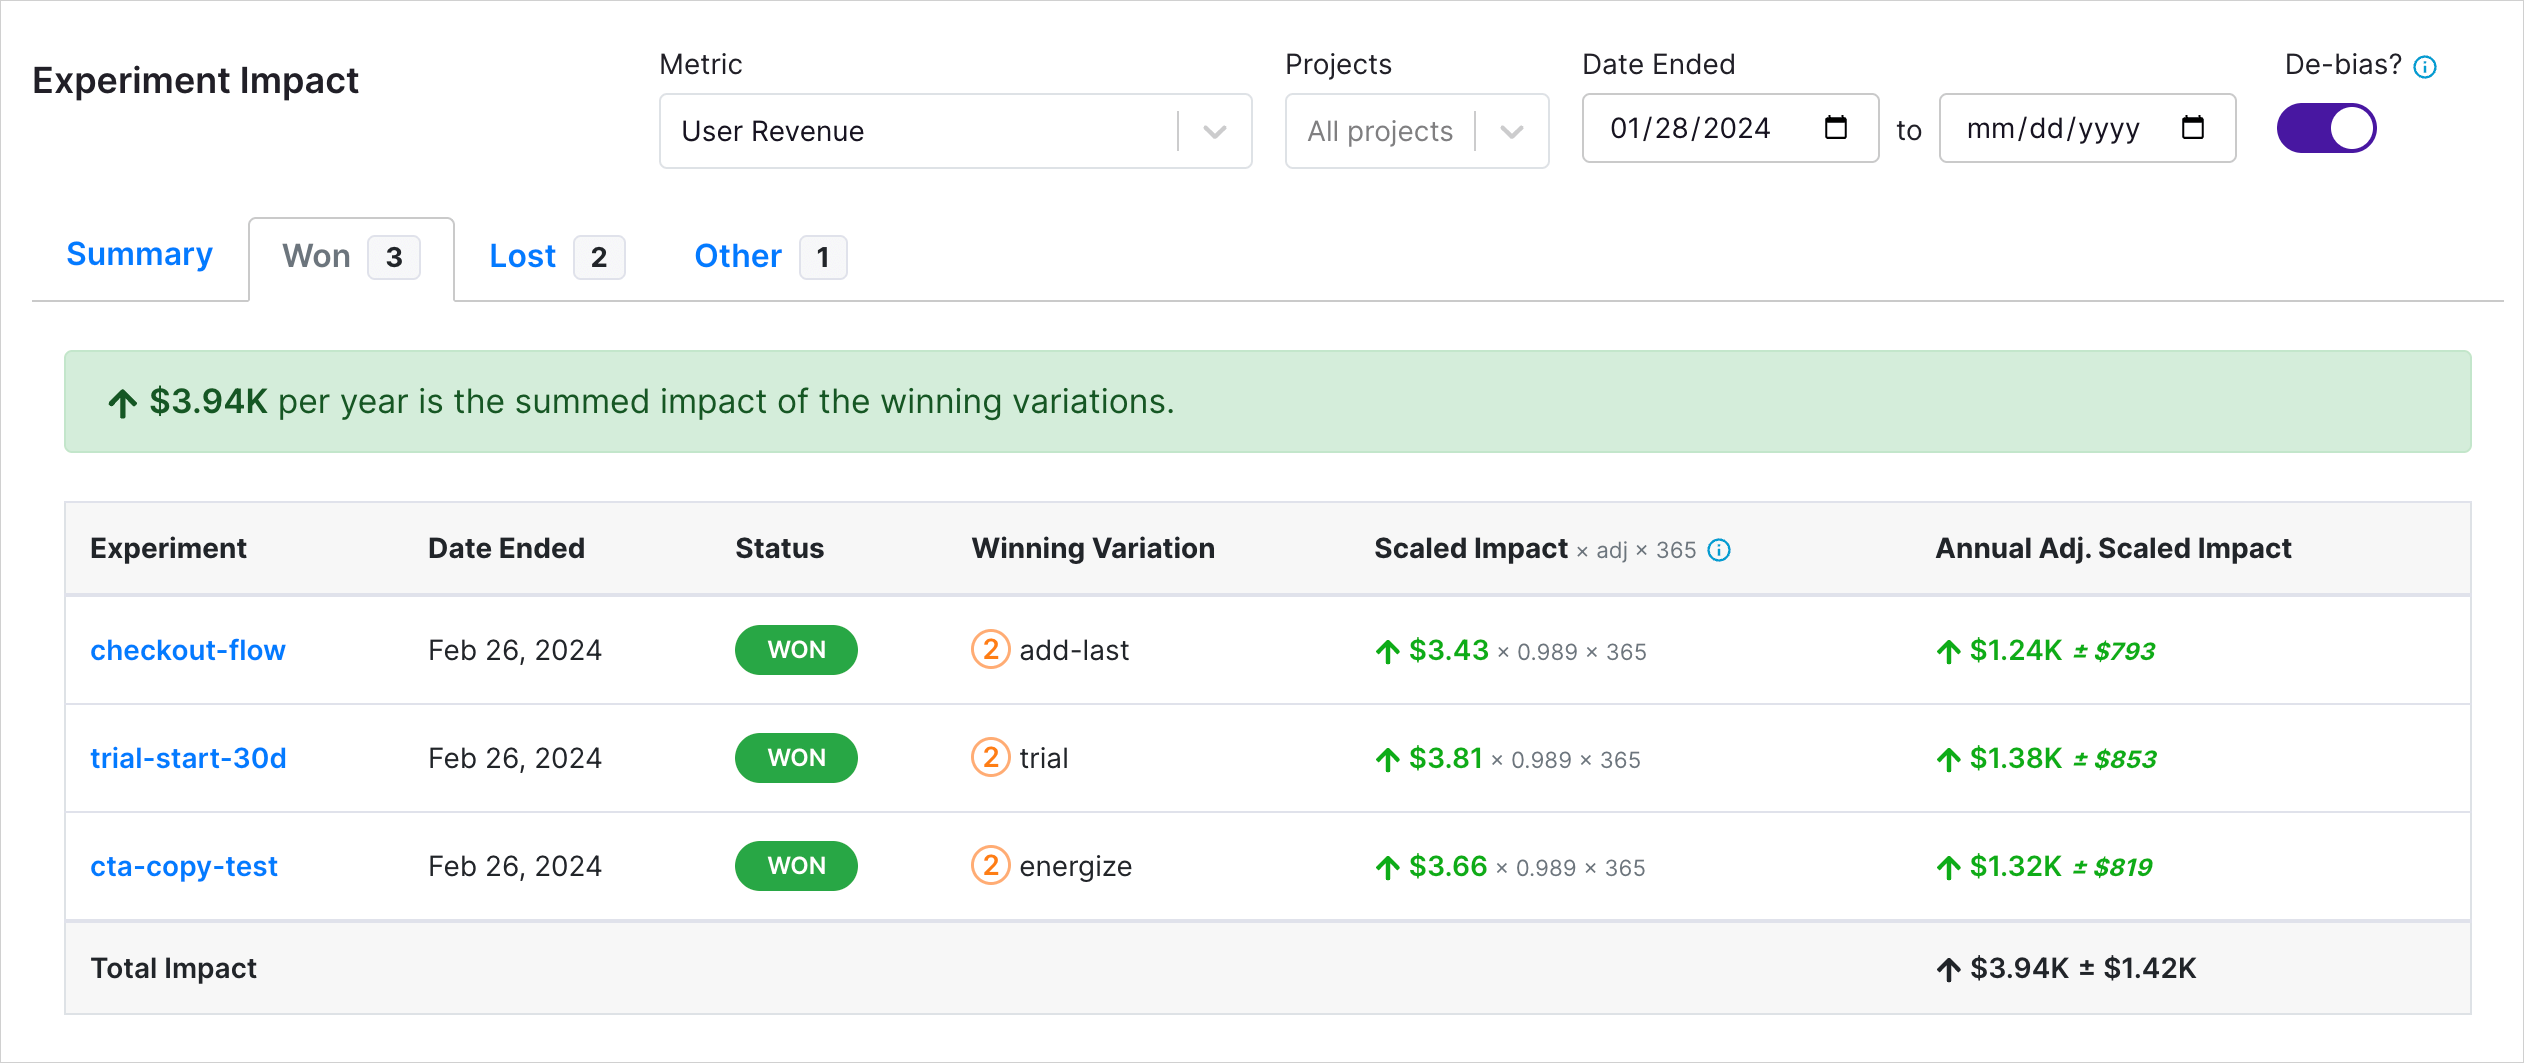
By selecting the "de-bias" option, you can reduce bias in the estimates. This example shows a slight reduction in estimates, with the Scaled Impact column reflecting a shrinkage multiplier (i.e., 0.989). The degree of shrinkage depends on the range of effect sizes in the filtered experiments.