A/A Testing in GrowthBook
What is an A/A Test?
A/A tests are a form of A/B test where there is no difference between variations (each "variation" is labeled as "A"). They are used to test whether your experimentation set up and methodology is working as expected.
Users who are placed into your A/A test receive the same user experience regardless of which variation they view. Thus, you'll expect to see almost identical results for each "variation" since all users are viewing the same thing. This helps to ensure that you've integrated the GrowthBook SDK correctly, that traffic is flowing as expected, and that your Metrics are defined properly, all before you begin experimenting on features that matter!
Because all users get the same user experience, any variation in traffic flows or Metric values can be attributed either to errors in your experiment or SDK setup, or to random chance. Metric variations in A/A tests are covered in more detail below.
When should I run an A/A test in GrowthBook?
There are two scenarios in which it is a good idea to run an A/A test:
You've set up a new SDK connection. Once your SDK is connected and you configure the trackingCallback method, you can validate that the experiment data is being sent correctly to your data warehouse.
There are changes to any part of the GrowthBook integration, such as changes to your data warehouse, the tracking libraries (Google Analytics [GA4], Segment, Amplitude, etc.), or changes to the GrowthBook-related code within your application.
How do I run an A/A test in GrowthBook?
An A/A test is run just as an A/B test would be run. Follow the usual instructions for creating an experiment and ensure the "variations" are serving the same values.
The feature for your A/A test will look something like this:
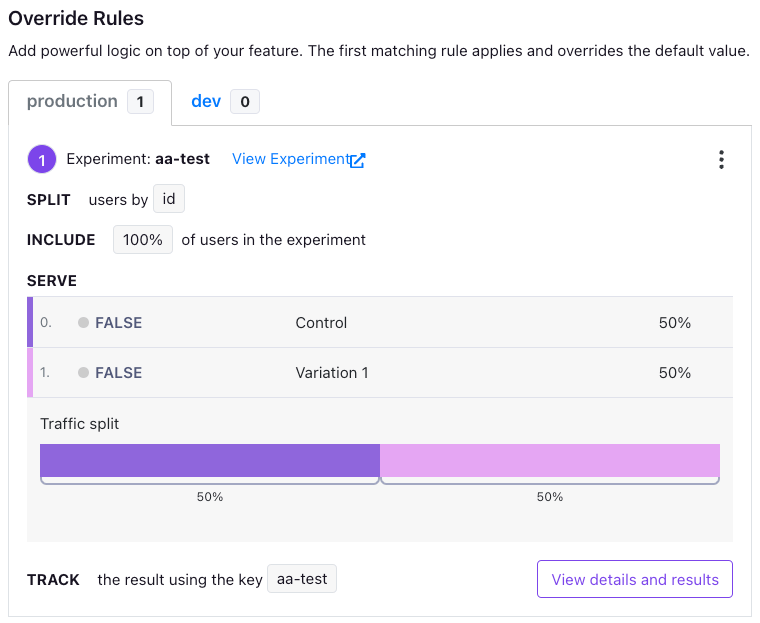
Then, start your experiment just as you would any other experiment. Wait until it has been live for a few hours or days, depending on how much traffic you get, then take a look at the results.
What problems can an A/A test reveal?
A/A tests are a low-risk approach to help ensure that your experiment is set up correctly.
Problem: No traffic, incorrect metric values, or SRM errors (imbalanced traffic)
For these errors, check our troubleshooting guide.
Problem: Metrics show statistically significant lifts in the A/A test
The main goal of an A/A test is to ensure your experimentation system is set up correctly. One common way to test this is to confirm that all of the Metrics appear balanced across the two variations. In an ideal world, there would be no statistically significant Metric movements between the two variations, because if everything is set up correctly the two variations should have produced (nearly) identical results.
In a clearly broken A/A test, you might see 3-4 Metrics all statistically significant with > 99%+ or < 1% chance to win. This is a clear sign that something is wrong with the experimentation set up.
However, there are often cases where only one or two Metrics are significant, and maybe only just across your significance thresholds. Often this is not a problem and can be a false positive, especially if you added many metrics to your A/A test. Understanding why this is requires a bit of background on statistical significance and false positives in experiments.
Understanding significance and false positives rate
In experimentation, it is necessary to allow some amount of "wiggle room" when calling a result "statistically significant". In GrowthBook, our default is to state that a Metric is statistically significant if there is a 95% chance that the variation is better than the baseline (a positive result), or only a 5% chance that it is better (a negative result). This means that a significant positive result is actually better than the baseline 95% of the time; in other words, 5% of the time, it isn't actually better!
We allow this 5% chance, also known as the "false positive rate", because we want to be able to declare a winner in an experiment even when we're not 100% certain.
For an A/A test, this means that even if your experiment set up is perfect and everything is balanced, you still have a chance of seeing a statistically significant result due to randomness. Even if you run your A/A test for months, you can still see some imbalance just due to bad luck in the randomization.
If you run an A/A test with one Metric and use GrowthBook's default 95% and 5% thresholds, you have a 10% chance of seeing a "statistically significant" result even when there is no real difference between the variations.
Furthermore, the more Metrics you add to your test, the greater the probability of seeing a false positive rate! If you have 2 unrelated Metrics in your A/A test, your chance of getting at least one false positive is 19%, and with 5 unrelated Metrics, it's 41%!
You can lower your false positive rate by lowering the "Chance to Win Threshold" in your Organization settings, but that just means it will also take longer for actual A/B experiments to reach your significance level.
So, what does this mean practically for A/A tests?
- If you have an A/A test with 10 substantively different Metrics, and 7 of them are statistically significant, and the differences are large (e.g. not 96% chance to win, but 99.9+), then you can plausibly state that something is wrong and you may want to dig into your set up further. Use the general solutions in the troubleshooting guide as hints for where to begin looking for errors.
- If you have an A/A test with 10 Metrics and 1 of them is statistically significant, or even 2 of them, then this is very plausibly due to chance and likely can be ignored and deemed a successful A/A test. Furthermore, if there are no SRM errors or other signs of issues with your experiment, that could lend further credibility to these few significant results being a false positive. You can restart your A/A test with re-randomization to confirm this if you want to. You should see a similar number of metrics reaching statistical significance, and they should not always be the same ones.
- Things get more complicated when you have 10 Metrics and 3-4 of them show statistically significant differences. In these cases, you should consider whether the Metrics are related to one another. If you have three "purchase" Metrics that are highly correlated with one another, then it's plausible that one "unlucky" draw caused this statistical significance and the A/A test is working fine. In this situation, you should consider restarting your A/A test to confirm this theory. If all three Metrics are quite different from one another, then it's stronger evidence that something may be wrong in your set up.
Restarting an A/A test
If you found some issues with your set up and want to re-run your A/A test, or if you had a Metrics imbalance that you are still uncertain about, you should usually restart the A/A test and run it again.
You have two options:
- Create an entirely new experiment. This may be the best and cleanest option since you ensure you are using a new tracking key, new set up, and are unlikely to have any issues carrying over from the old experiment.
- Restart the existing experiment with a new phase. This is the easiest approach, and will likely work in most cases. You can do this as follows:
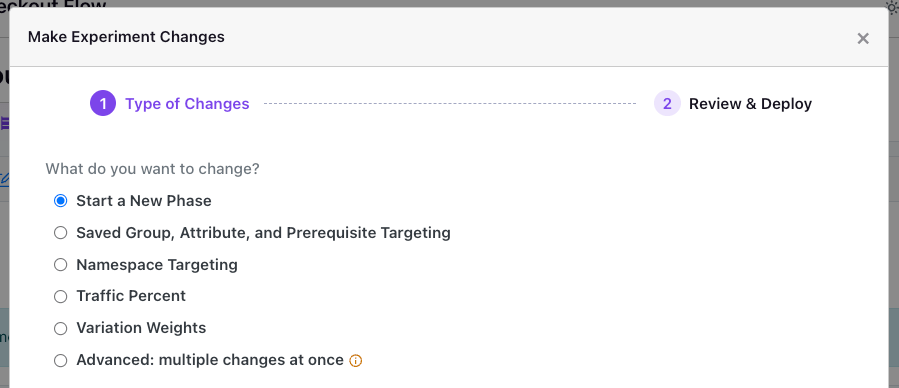
Use the "Make Changes" flow in the A/A experiment page.
Use this flow to "Start a New Phase" and make sure you "re-randomize traffic" to ensure that users returning to your test will be re-randomized into variations (this will re-set the seed for the experiment, causing users to get randomly re-assigned).