Savings from Fact Metric Optimization
Fact Tables can dramatically reduce the number of rows scanned by an experiment analysis in GrowthBook. This article explains how Fact Tables work and how they can optimize your queries.
How do Fact Tables Optimize Queries?
Fact Tables are one of the best tools for controlling query runtime and costs in GrowthBook for Enterprise customers. You can read more about how we achieve the optimization in this blog post, but the following section provides an overview.
Fact Tables allow you to define multiple metrics on top of one shared table in your data warehouse. When multiple metrics from the same Fact Table are added to an experiment, we only scan that Fact Table once for all metrics when updating results. Therefore, if multiple metrics come from the same table in your warehouse, you should define them in a single Fact Table.
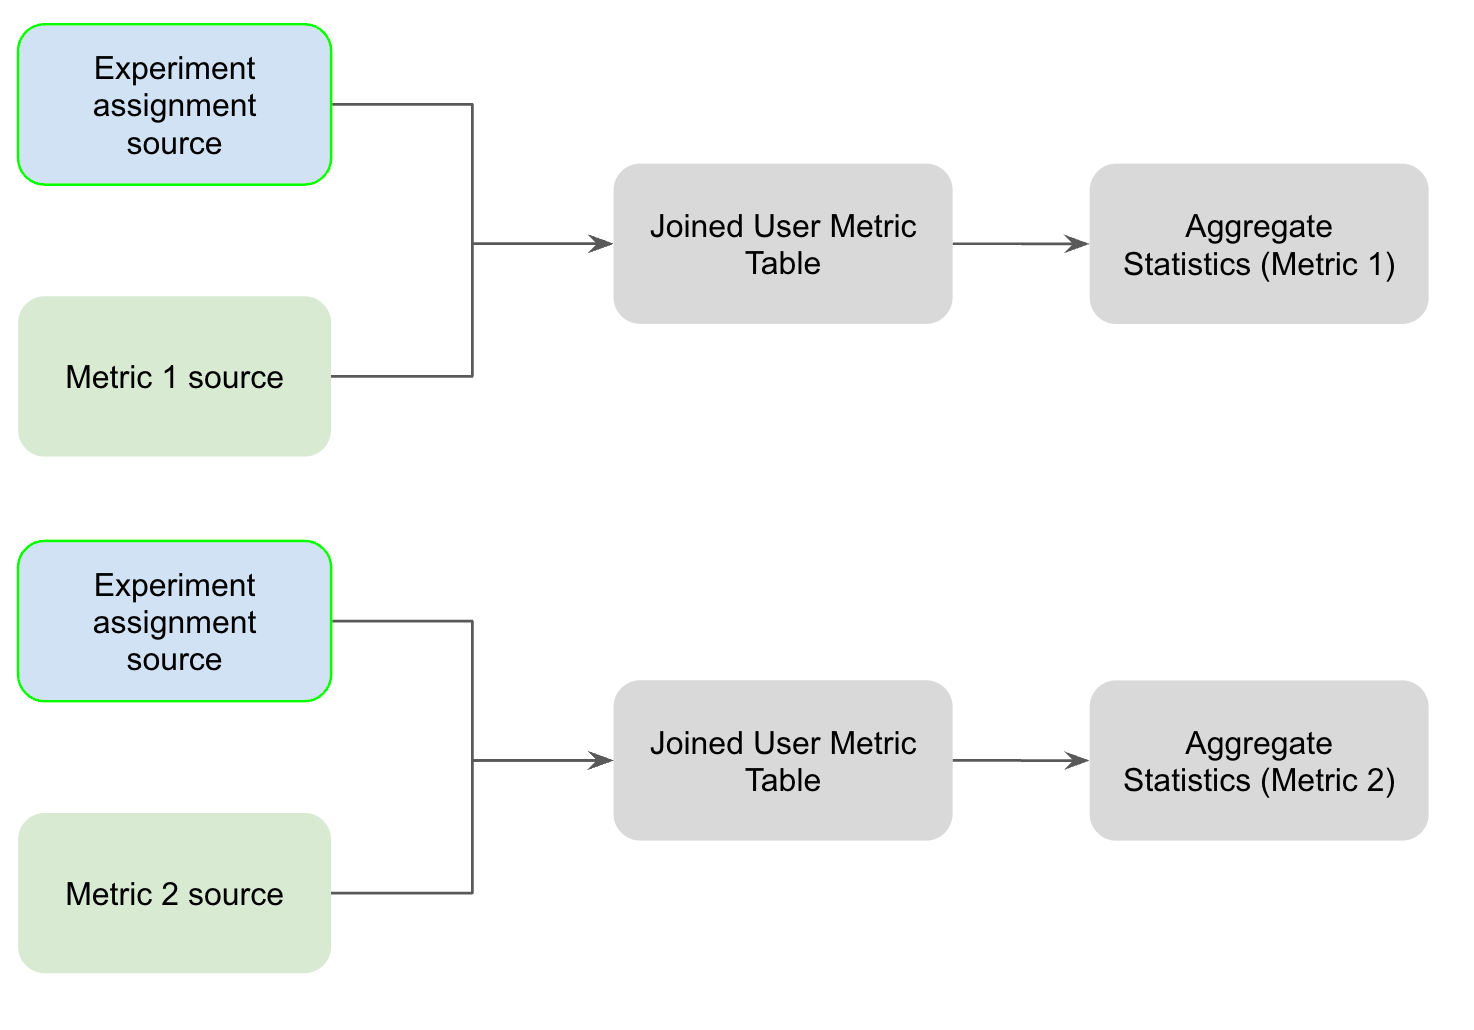
Here's the analyses we run without fact tables. As you can see, each experiment assignment source is scanned and joined to the metric source for each experiment. Furthermore, each metric is scanned separately, even if they come from the same underlying table in your data warehouse.

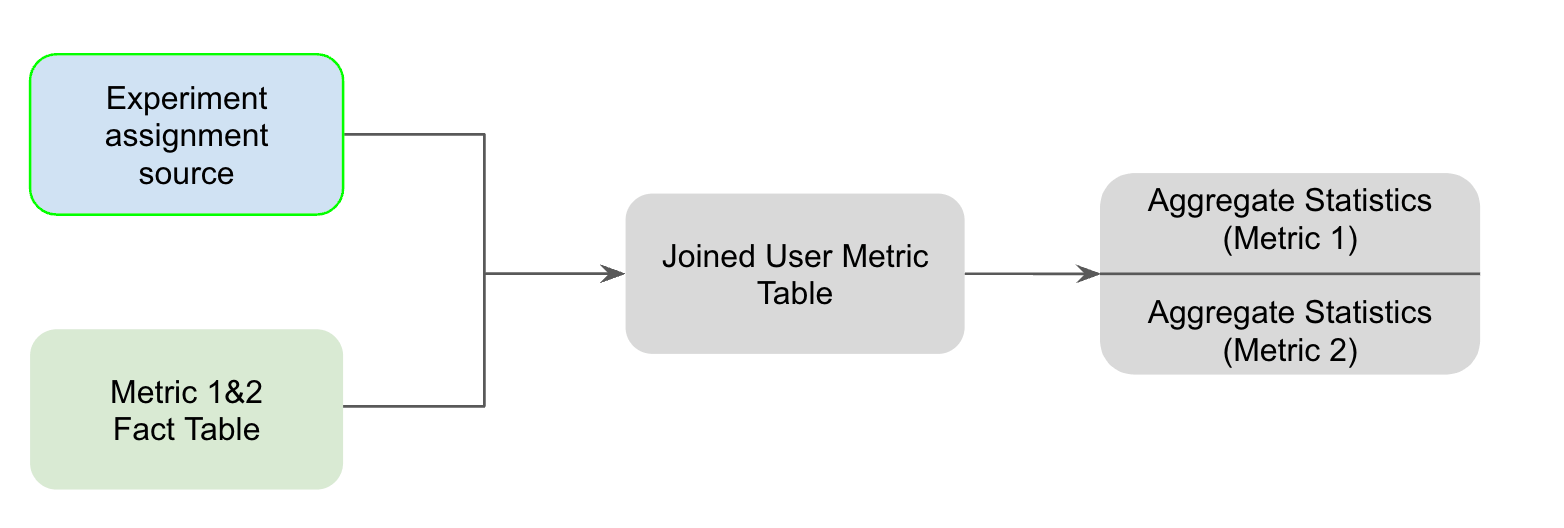
With fact tables, we only need to scan the experiment assignment source once per Fact Table and join it once to a single scan of the Fact Table, even if you have 10 metrics defined on that fact table. We then store the metrics in a wide format in the join User Metric table and then aggregate them all in one query.

How Many Fewer Rows are Scanned?
Imagine you have 10 metrics that come from 2 tables and each table has around 100M rows. Furthermore, say your experiment assignment source has around 10M rows itself.
For an analysis without Fact Tables, you would scan (10M*10 + 100M*10)=1,100M rows.
For an analysis where the 10 metrics are in 2 Fact Tables, you would scan (100M*2 + 10M*2)=220M rows.
That is a reduction from 1,100M to 220M rows scanned!
With BigQuery on-demand pricing, this represents huge savings per analysis. Over the course of an experiment that updates daily, these savings compound. Furthermore, because we place the data from a Fact Table in a wide table, we do far less computationally costly joins with Fact Tables. This means that Fact Tables will also often reduce costs associated with compute or runtime, not just rows scanned.
In general the savings go up when you increase the number of metrics per fact table and as you increase the number of metrics per experiment.
Recommendations
If you have multiple metrics that are defined on the same table (e.g. a “sign-ups” table or a very broad “events” table), then it makes sense to create a Fact Table for that entire table and use Filters and Column definitions to help build your Metrics Library. The more metrics you can define on one table, the better, but sometimes it can make sense to create two Fact Tables to help keep your Metrics library organized or to prevent having to do JOIN statements directly in your Fact Table SQL.
Read more about Fact Tables in our docs.