Aggregate Data and the Statistics Engine
GrowthBook never collects user-level events or PII. To power our statistics engine, contained within the gbstats Python library, GrowthBook works solely with aggregate level data that is sufficient to conduct analyses of interest.
Working with sums
Specifically, GrowthBook mostly relies on queries that run on your data warehouse and return data aggregated across users. We aggregate data at the level of the experiment variation (or dimension-variation, if you have dimensions specified). We rely on sums, sums of squares, and sums of cross products to power our statistics engine. These simple quantities allow us to easily re-aggregate over different dimensions while still containing sufficient information to compute experiment statistics.
Note that these are the aggregations at the experiment variation level---they are computed across users. These often follow an aggregation at the user level, which defaults to SUM for non-binomial metrics, or a 1 for binomial metrics. You may have overridden the user-level aggregation in your metric definition with some other function. However, when we then go to aggregate at the variation level, we sum across those user-level aggregations.
Aggregate fields
You can view the aggregate data we use for any metric in your experiment by selecting the three dots in the top right of the experiment table and clicking "View Queries". There, you can see the actual queries we build and the aggregate results they contain. The following image is an example of those aggregate values.
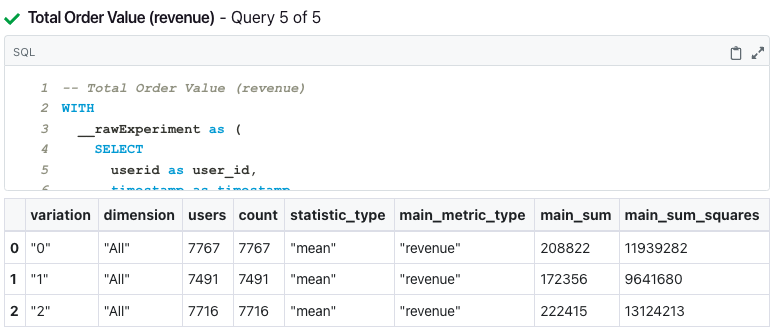
The potential fields the queries will return are as follows, with all sums aggregating at the variation-dimension level:
variation- the name of the experiment variationdimension- the name of the dimension we aggregate to; defaults to "All" if there is no dimensional analysis specifiedusers- the number of users in the variation-dimension that are part of the denominator for that metric; normally this is all users in the variation-dimension, but for ratio metrics or activation metrics it will only include users that are in the ratio denominator or in the set of activated users.count- deprecated; duplicate of usersstatistic_type- one of "mean" or "ratio"; this indicates to the statistics engine how to process the data as the formulae for the variance is different across these statistic typesmain_metric_type- the metric type of the main metric (e.g. the metric itself or the numerator for ratio metrics)main_sum- the summed value of the user-level main metricmain_sum_squares- the sum of the squared values of the user-level main metric
If the metric is a ratio metric, you will additionally see the following fields:
denominator_metric_type- the metric type of the denominator metricdenominator_sum- the summed value of the user-level denominator metricdenominator_sum_squares- the sum of the squared values of the user-level denominator metricmain_denominator_sum_product- the sum of the product of the user-level main and denominator metric