Multiple Testing Corrections
If you test a bunch of things at once, you will naturally get some results that look good, but aren't real! This page explains this problem in detail and how you can control it with GrowthBook.
What is the multiple testing problem?
In the frequentist framework, testing more than one hypothesis at a time increases the probability that you find a false positive, beyond the user's specified rate of , often 0.05. This is often known as the multiple testing, or multiple comparisons, problem.
In online AB testing, experimenters will often be running hundreds of tests, if not tens of thousands, of tests, at the same time. In this setting, a "test" tends to be the comparison of variation A vs variation B, for one group, for one metric. If you are running 10 experiments with 2 variations, each with 10 metrics, you are running 100 tests at one time. Even if the test had no effect on any metric, having this many tests will dramatically increase the chance of seeing a false positive.
Error rates
To understand approaches to solving this issue, let's first define two the False Discovery Rate (FDR) and the Family Wise Error Rate (FWER).
In plain English, the FDR is proportion of your significant results that are false. If you control your FDR at 0.05 (or 5%), and you get 20 significant results, on average only 1 of these should be a false positive.
The FWER is the probability of at least one test being a false positive. This tends to be much stricter as the number of tests grows.
We can write both as follows, where is the number of tests that are statistically significant but are false positives and are the number of tests that are statistically significant.
Corrections in GrowthBook
Statistical methods
Growthbook allows you to choose no multiple testing correction, a correction that controls the Family-wise Error Rate (Holm-Bonferroni), and a correction that controls the False Discovery Rate (Benjamini-Hochberg).
Which you choose depends on your tolerance for false positives, the number of tests you are running, and your comfort with each procedure. General guidance would be that if your analysis is more exploratory, controlling the FDR and having a slightly higher false positive rate may be better, while controlling the FWER will give you more guarantees that your results are reliable. However, with enough tests, controlling the FWER may completely undermine your test power.
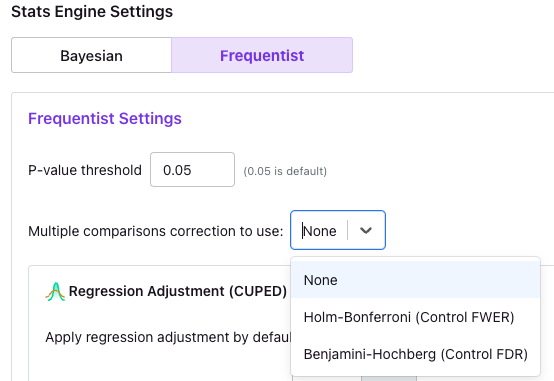
You can set this for your organization in the Organization → Settings page, as seen below:
Once you make a selection, adjustments will happen on-the-fly in experiment results and reports. For now, these adjusted p-values are only available in the UI or in downloadable CSVs and not exportable via the API.
The corrections we implement do not have directly analogous confidence intervals. Nonetheless, we do construct confidence intervals in an ad-hoc manner after adjusting p-values. We take the adjusted p-values and we back out what the experiment effect standard deviation would need to be to produce that adjusted p-value. We then construct CIs using this adjusted standard deviation. In this way, adjusted p-values below your p-value threshold should always coincide with confidence intervals that do not cross zero.
Some adjusted p-values are 1, in which case the ad-hoc confidence interval constructed in this way is undefined.
Unadjusted confidence intervals are available in the metric tooltip.
Holm-Bonferroni (controlling FWER)
To control the FWER, we implement the Holm-Bonferroni method. This method is an adaptation of the well known Bonferroni method, which simply multiplies p-values by the number of tests in the family.
The Holm-Bonferroni does just as well as the Bonferroni method to control the FWER, but it is less conservative. The main trade-off is that the implementation is slightly more complex, and one cannot adjust the confidence intervals in a meaningful way. There are other approaches that are even less conservative, but they require making assumptions about the dependence between tests to guarantee FWER control.
Benjamini-Hochberg (controlling FDR)
To control the FDR, we implement the Benjamini-Hochberg procedure. This method does assume that the tests are independent or positively correlated. There are methods that make fewer assumptions (such as the Benjamini-Yekutieli method), but they can be even more conservative than Bonferroni corrections.
Therefore, in order to provide a reasonably powered approach that controls the FDR in some conditions, and to select an approach that has widespread adoption, we implemented the Benjamini-Hochberg procedure.
Defining a family of tests
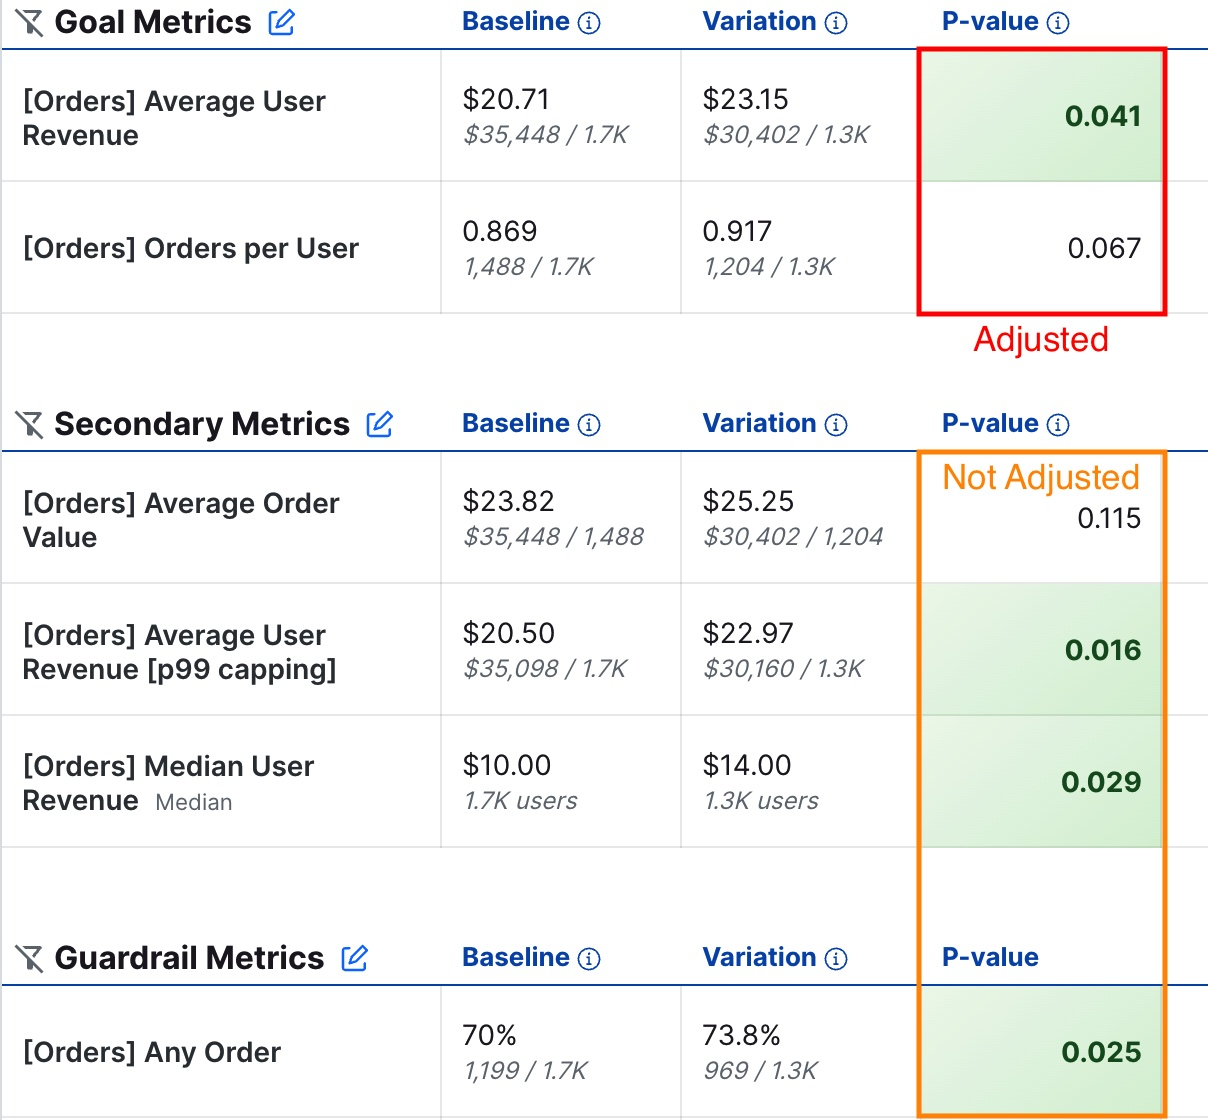
Controlling for multiple comparisons across all of the tests one can run in GrowthBook, even within the context of one experiment, is impractical and can be prohibitively costly in terms of statistical power. Instead, GrowthBook corrects across all Goal metrics, variations, (and dimension values, if available) in a particular result view.
We correct using all p-values for all Goal metrics; this excludes Secondary and Guardrail metrics.
On overall results
On the experiment results overall page, we collect all tests across Goal metrics and variations to be part of a family, and correct within those values. The following image circles the p-values that we collect and adjust for on the overall results page for an experiment.
Within dimensional slices
If you look within dimensional slices, to account for the additional increase in tests from dimensional splits, we define the family of tests as all tests across all dimension groups, Goal metrics, and variations. This means for a 2-armed test, with 4 goal metrics, and a dimension with 3 levels, we correct across a total of 24 tests.
These dimension results are corrected independently from the overall results.