

Arize Phoenix Event Tracker Setup
BetaThe Arize Phoenix event tracker is in beta. It queries Phoenix’s own Postgres database, which is not a stable API; re-validate the generated SQL after upgrading Phoenix.
Exposure Tracking
There is no separate exposure event. Each trace’s root span carries the GrowthBook assignment as an OpenInference tag of the formgb.exp:<experimentKey>=<variationKey> (in the tag.tags attribute), and the exposure query reads those tags from the spans table.
In JavaScript, the tracing plugin collects these tags for you. Put them, together with the user id, on the OpenTelemetry context before the root span starts:
- The OpenInference
user.id(andsession.id, if used) must equal the value of the GrowthBook attribute the experiment hashes on. - Experiment keys must not contain
=.
Integrating with Phoenix Data
This tracker works with Phoenix backed by Postgres.- Connection type: Postgres, pointed at Phoenix’s Postgres database. Use a read-only role.
- Option
Phoenix project name— the Phoenix project your traces are sent to. Leave blank to include every project.
- Identifier types
user_id,session_id, andtrace_id, with an exposure query for each and an identifier join betweenuser_idandsession_id. Exposure queries exposetrace_nameas an experiment dimension. - Fact table
Phoenix Traces(one row per trace, with root-spanstatus_code,latency_ms, and cumulative token counts). Filter Errors. Metric Traces per user. - Fact table
Phoenix Spans(one row per span, withspan_kind,model,latency_ms, token counts, andtotal_costfromspan_costs). Filters LLM Spans and Errors. Metrics LLM calls per user, LLM cost per user, LLM error rate, p95 LLM latency, and Tokens per LLM call. - Fact table
Phoenix Annotations(one row per span annotation: LLM evals, code checks, human feedback). Filter LLM Evals.annotation_nameis an inline-filter column, so create a ratio metric (sum ofannotation_scoreover a count of rows, both filtered by the annotation name) to get, for example, average helpfulness. See Adding eval-score metrics. No annotation metrics are generated because annotation names are user-defined.
- The
span_coststable exists only on newer Phoenix versions. On older installs remove theLEFT JOIN ... span_costsand thetotal_costcolumn from thePhoenix Spansfact table. trace_annotationsare not included yet; onlyspan_annotationsare.tag.tagsarrives as a JSON array from the Python SDK and as a JSON-encoded string from the JavaScript SDK. The generated SQL handles both.- Changing the project name later in the data source settings does not rewrite SQL that was already generated.
Configuration Settings
Once you have chosen your event tracker and data source type and successfully connected, you will be given an opportunity to modify your configuration settings. For many applications GrowthBook will have chosen the correct configuration settings straight out of the box based upon which event tracker you choose. In some instances you may need to tweak them slightly, or in the case of using a custom datasource, define them more explicitly.Identifier Types
These are all the types of identifiers you use to split traffic in an experiment and track metric conversions. Common examples areuser_id, anonymous_id, device_id, and ip_address.
Experiment Assignment Queries
An experiment assignment query returns which users were part of which experiment, what variation they saw, and when they saw it. Each assignment query is tied to a single identifier type (defined above). You can also have multiple assignment queries if you store that data in different tables, for example one from your email system and one from your back-end. The end result of the query should return data like this:
The above assumes the identifier type you are using is
user_id. If you are using a different identifier, you would use a different column name.
Here’s an example query you might use:
SELECT original_column as new_column).
Duplicate Rows
If a user sees an experiment multiple times, you should return multiple rows in your assignment query, one for each time the user was exposed to the experiment. This helps us detect when users were exposed to more than one variation, and eventually may be useful in helping build interesting time series.Experiment Dimensions
In addition to the standard 4 columns above, you can also select additional dimension columns. For example,browser or referrer. These extra columns can be used to drill down into experiment results.
Identifier Join Tables
If you have multiple identifier types and want to be able to auto-merge them together during analysis, you also need to define identifier join tables. For example, if your experiment is assigned based ondevice_id, but the conversion metric only has a user_id column.
These queries are very simple and just need to return columns for each of the identifier types being joined. For example:
SQL Template Variables
Within your queries, there are several placeholder variables you can use. These will be replaced with strings before being run based on your experiment. This can be useful for giving hints to SQL optimization engines to improve query performance. The variables are:- startDate -
YYYY-MM-DD HH:mm:ssof the earliest data that needs to be included - startYear - Just the
YYYYof the startDate - startMonth - Just the
MMof the startDate - startDay - Just the
DDof the startDate - startDateUnix - Unix timestamp of the startDate (seconds since Jan 1, 1970)
- endDate -
YYYY-MM-DD HH:mm:ssof the latest data that needs to be included - endYear - Just the
YYYYof the endDate - endMonth - Just the
MMof the endDate - endDay - Just the
DDof the endDate - endDateUnix - Unix timestamp of the endDate (seconds since Jan 1, 1970)
- experimentId - Either a specific experiment id OR
%if you should include all experiments
'{{ startDate }}' instead of just {{ startDate }})
Jupyter Notebook Query Runner
This setting is only required if you want to export experiment results as a Jupyter Notebook. There is no one standard way to store credentials or run SQL queries from Jupyter notebooks, so GrowthBook lets you define your own Python function. It needs to be calledrunQuery, accept a single string argument named sql, and return a pandas data frame.
Here’s an example for a Postgres (or Redshift) data source:
Schema Browser
When you connect a supported data source to GrowthBook, we automatically generate metadata that is used by our Schema Browser. The Schema Browser is a user-friendly interface that makes writing queries easier as you can easily explore information about the datasource such as databases, schemas, tables, columns, and data types.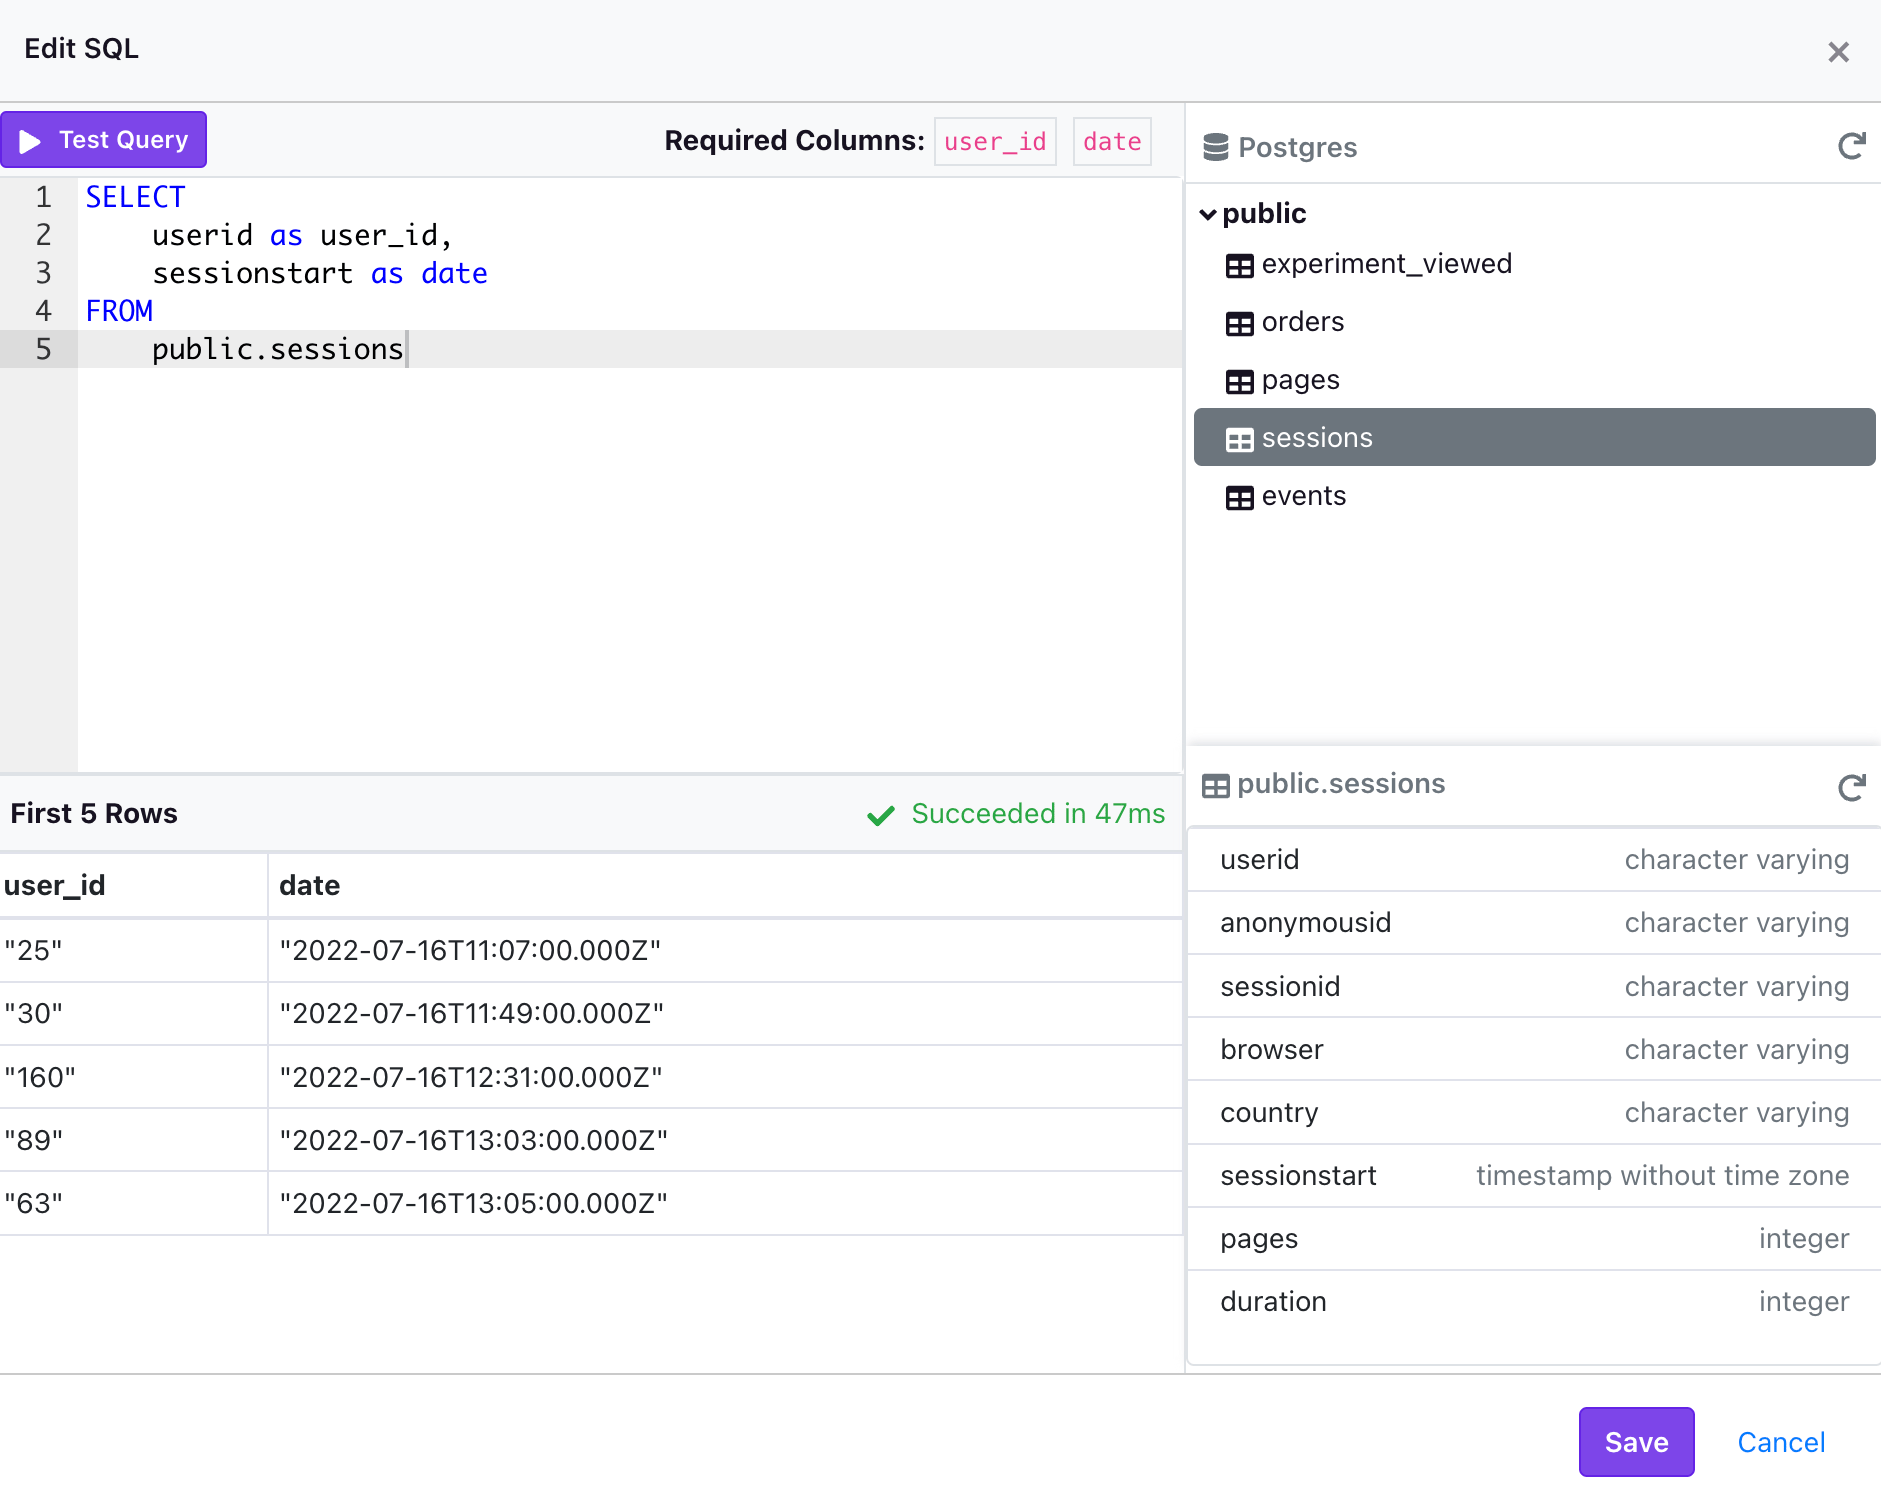
- AWS Athena - Requires a Default Catalog
- BigQuery - Requires a Project Name and Default Dataset
- ClickHouse
- Databricks - Currently only supported on version 10.2 and above with a Unity Catalog
- MsSQL/SQL Server
- MySQL/MariaDB
- Postgres
- PrestoDB (and Trino) - Requires a Default Catalog
- Redshift
- Snowflake