Experiment Dashboards
EnterpriseDashboards is available on Enterprise plans.
Use experiment dashboards to create tailored views of your experiment. Highlight key insights, add context, and share a clear story with your team.
Creating Dashboards
To create a new dashboard, go to the experiment you want to create a dashboard for and click the Dashboards tab. If there are no dashboards yet, click the Create Dashboard button. If there are existing dashboards, the first one will be open automatically when you go to the tab. To create a new dashboard, open the select box in the top left, which lets you switch between dashboards. There will be an option there to Create New Dashboard.
Give the dashboard a name and select a few options:
- Auto-update dashboard data - If enabled, the dashboard will automatically refresh its data whenever the experiment results are updated. If disabled, the dashboard will only refresh when you manually click the update button.
- View access - Control whether your organization members can view your new dashboard.
- Edit access - Share the ability to edit dashboard contents with your organization. Even when editing is shared, only the owner and organization admins can change access permissions.
After creating the dashboard, you will be able to add blocks to it.
Dashboard Blocks
An experiment dashboard consists of a set of blocks. There are several types of blocks you can add:
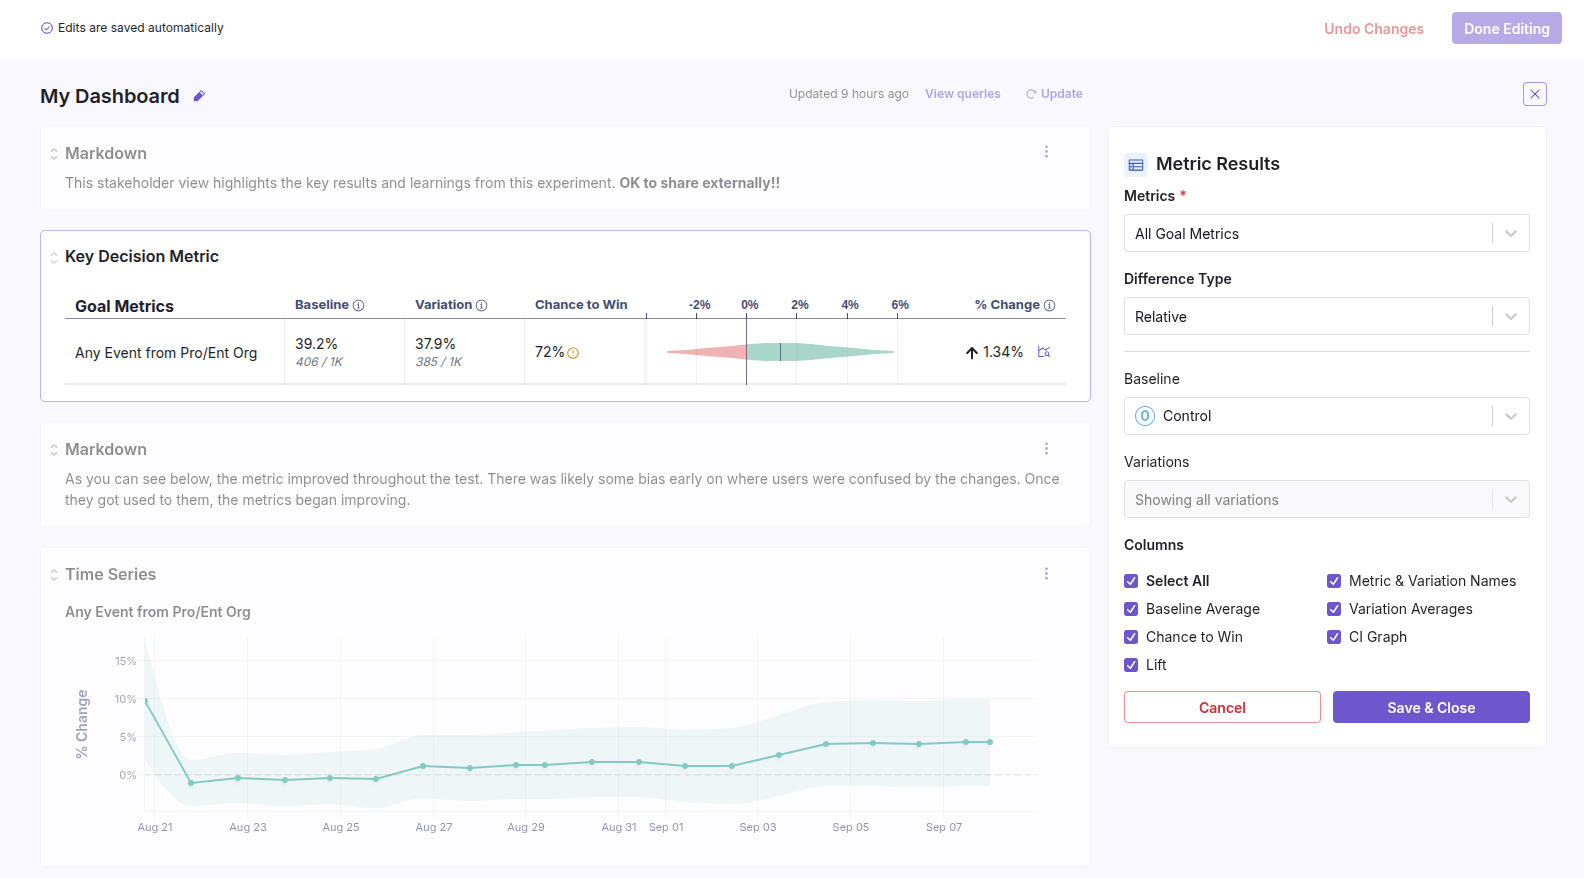
- Markdown: Add custom formatted text, images, and links to provide context and insights.
- Experiment Metadata: Display the description, hypothesis, and variation names/screenshots for the experiment.
- Experiment Traffic: Show the count of units in each experiment variation. Choose between a simple table or a timeseries chart.
- Metric Results: Include the main experiment results table, with the ability to customize the metrics and columns that are included.
- Dimension Results: Show a breakdown of a specific metric by a chosen dimension (e.g., country, device type). You can select which metric and dimension to display.
- Time Series: Display a timeseries chart for specific metrics within an experiment, allowing you to visualize trends over time.
- SQL Explorer: Show a visualization from a custom SQL query. This is useful for displaying data that isn't directly available in the standard experiment results.
Use a Dashboard as the Default Experiment View
You can set an experiment dashboard as the default view to present a more curated, stakeholder-friendly summary of your experiment results. This is particularly useful for presenting findings from stopped experiments in a way that's easier for non-technical stakeholders to understand.
Setting a dashboard as the default view for an experiment will require experiment edit permission.
To set a dashboard as the default view:
- Navigate to the experiment's Dashboards tab
- Select the dashboard you want to use
- Click the More menu (⋯) and select Edit Dashboard Settings - View access must be set to Organization members
- Click the More menu (⋯) and select Set as Default View
To revert to the standard view: Follow the same steps but select Remove as Default View from the More menu.
When a dashboard is set as the default view, you can still access the standard experiment view by clicking View Regular Experiment View above the dashboard.